Observability & Site Reliability
A streaming-media startup's ingest API, wired up with metrics, dashboards and alerts.
Fictionalised summary. Company names, the contact email and repository addresses are placeholders; no credential or token values are shown.
Domain & SKU
What this example orders, at a glance.
- Domain
- Observability & Site Reliability
- Deliverable
- Observability Stack Suite
- Turnaround
- Priority Overnight (under 14 hours)
- Environments in scope
- Linux VM
- Compliance
- None apply
02
Current State
Baseline architecture, stack, repository context and known friction.
Architecture & system context
Our stream-ingest API is a single Flask service running on one Linux VM. It exposes ingest endpoints, holds a simple in-memory buffer, runs one background worker thread and has a /healthz route. We read plain application logs when something goes wrong, and there are no metrics or dashboards at all.
Tech stack, frameworks & versions
- Python 3.11
- Flask 3.0
- Gunicorn
- Linux VM
Known issues, error logs & friction
We are blind until customers complain. We have application logs but no request-rate, error-rate or latency metrics, no dashboard and no alerts, so we usually learn about problems from support tickets.
Primary repository or architecture link
https://github.com/your-org/your-repoExisting metrics, logs & traces
- Application text logs on the VM
- /healthz endpoint (no metrics)
- No Prometheus, Grafana or tracing today
03
Target State
Deliverable expectations, measurable benchmarks and definition of done.
Deliverable expectations
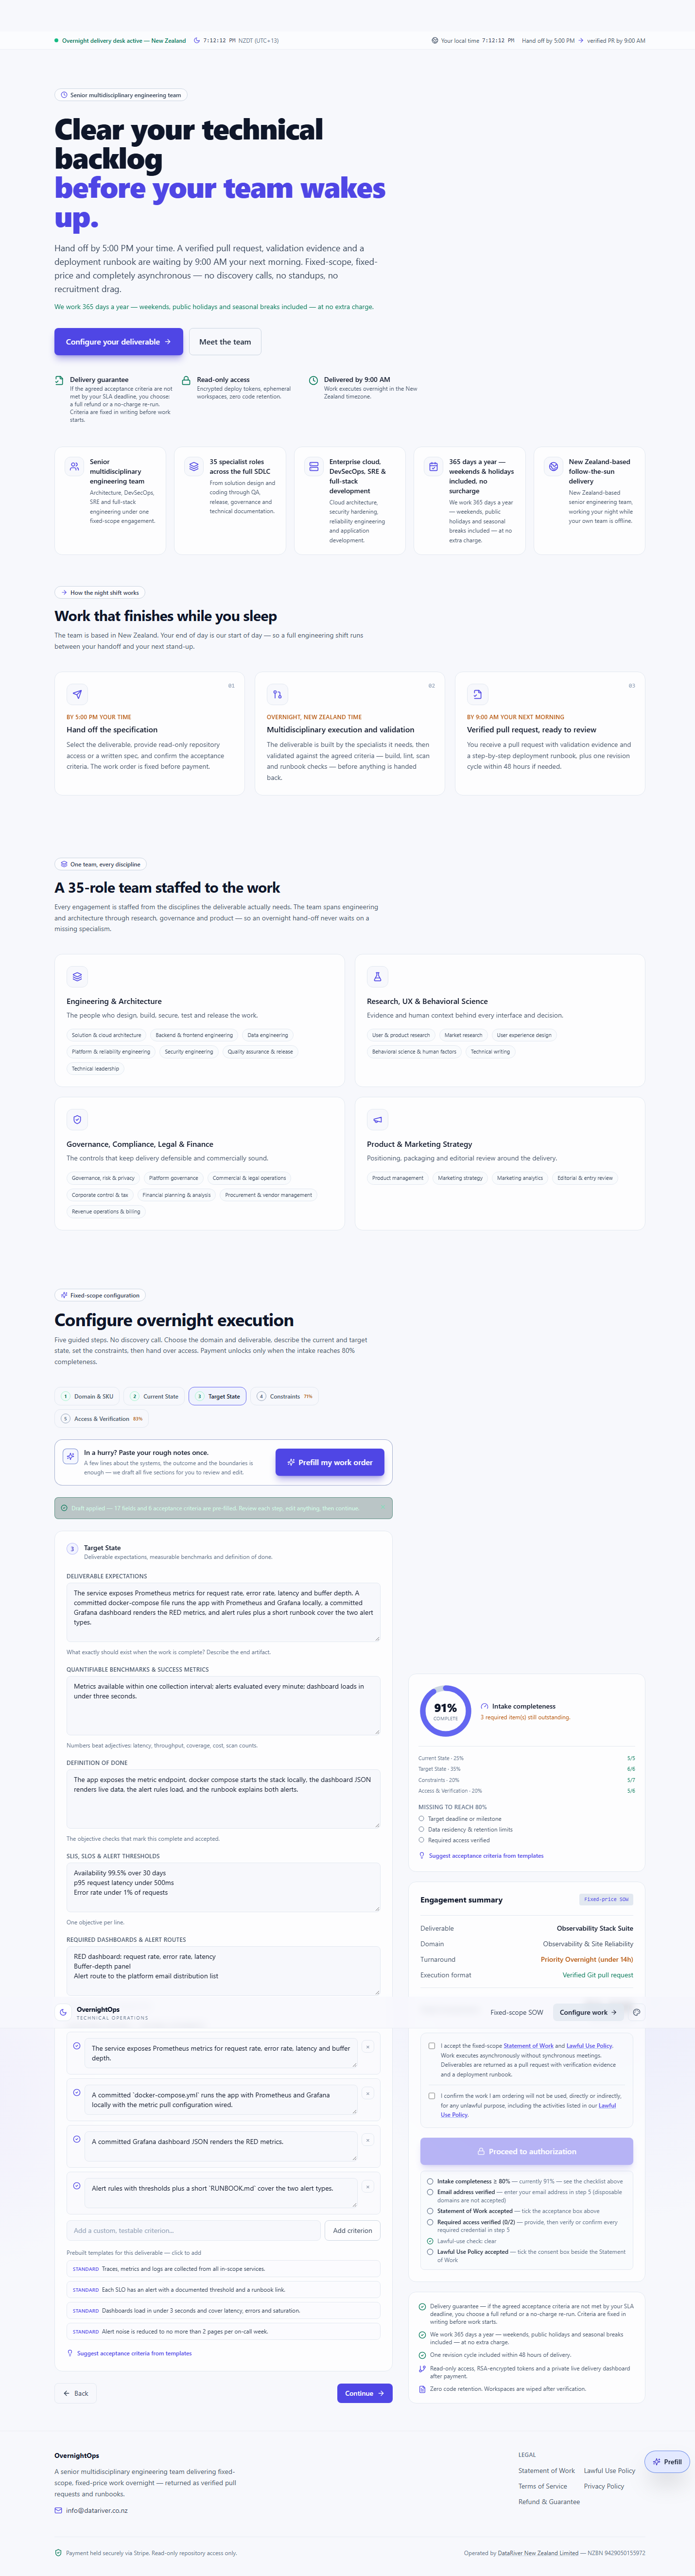
The service exposes Prometheus metrics for request rate, error rate, latency and buffer depth. A committed docker-compose file runs the app with Prometheus and Grafana locally, a committed Grafana dashboard renders the RED metrics, and alert rules plus a short runbook cover the two alert types.
Quantifiable benchmarks & success metrics
Metrics available within one collection interval; alerts evaluated every minute; dashboard loads in under three seconds.
Definition of done
The app exposes the metric endpoint, docker compose starts the stack locally, the dashboard JSON renders live data, the alert rules load, and the runbook explains both alerts.
SLIs, SLOs & alert thresholds
- Availability 99.5% over 30 days
- p95 request latency under 500ms
- Error rate under 1% of requests
Required dashboards & alert routes
- RED dashboard: request rate, error rate, latency
- Buffer-depth panel
- Alert route to the platform email distribution list
04
Constraints
Forbidden changes, compliance, regions, freeze windows and deadlines.
Forbidden modifications & boundaries
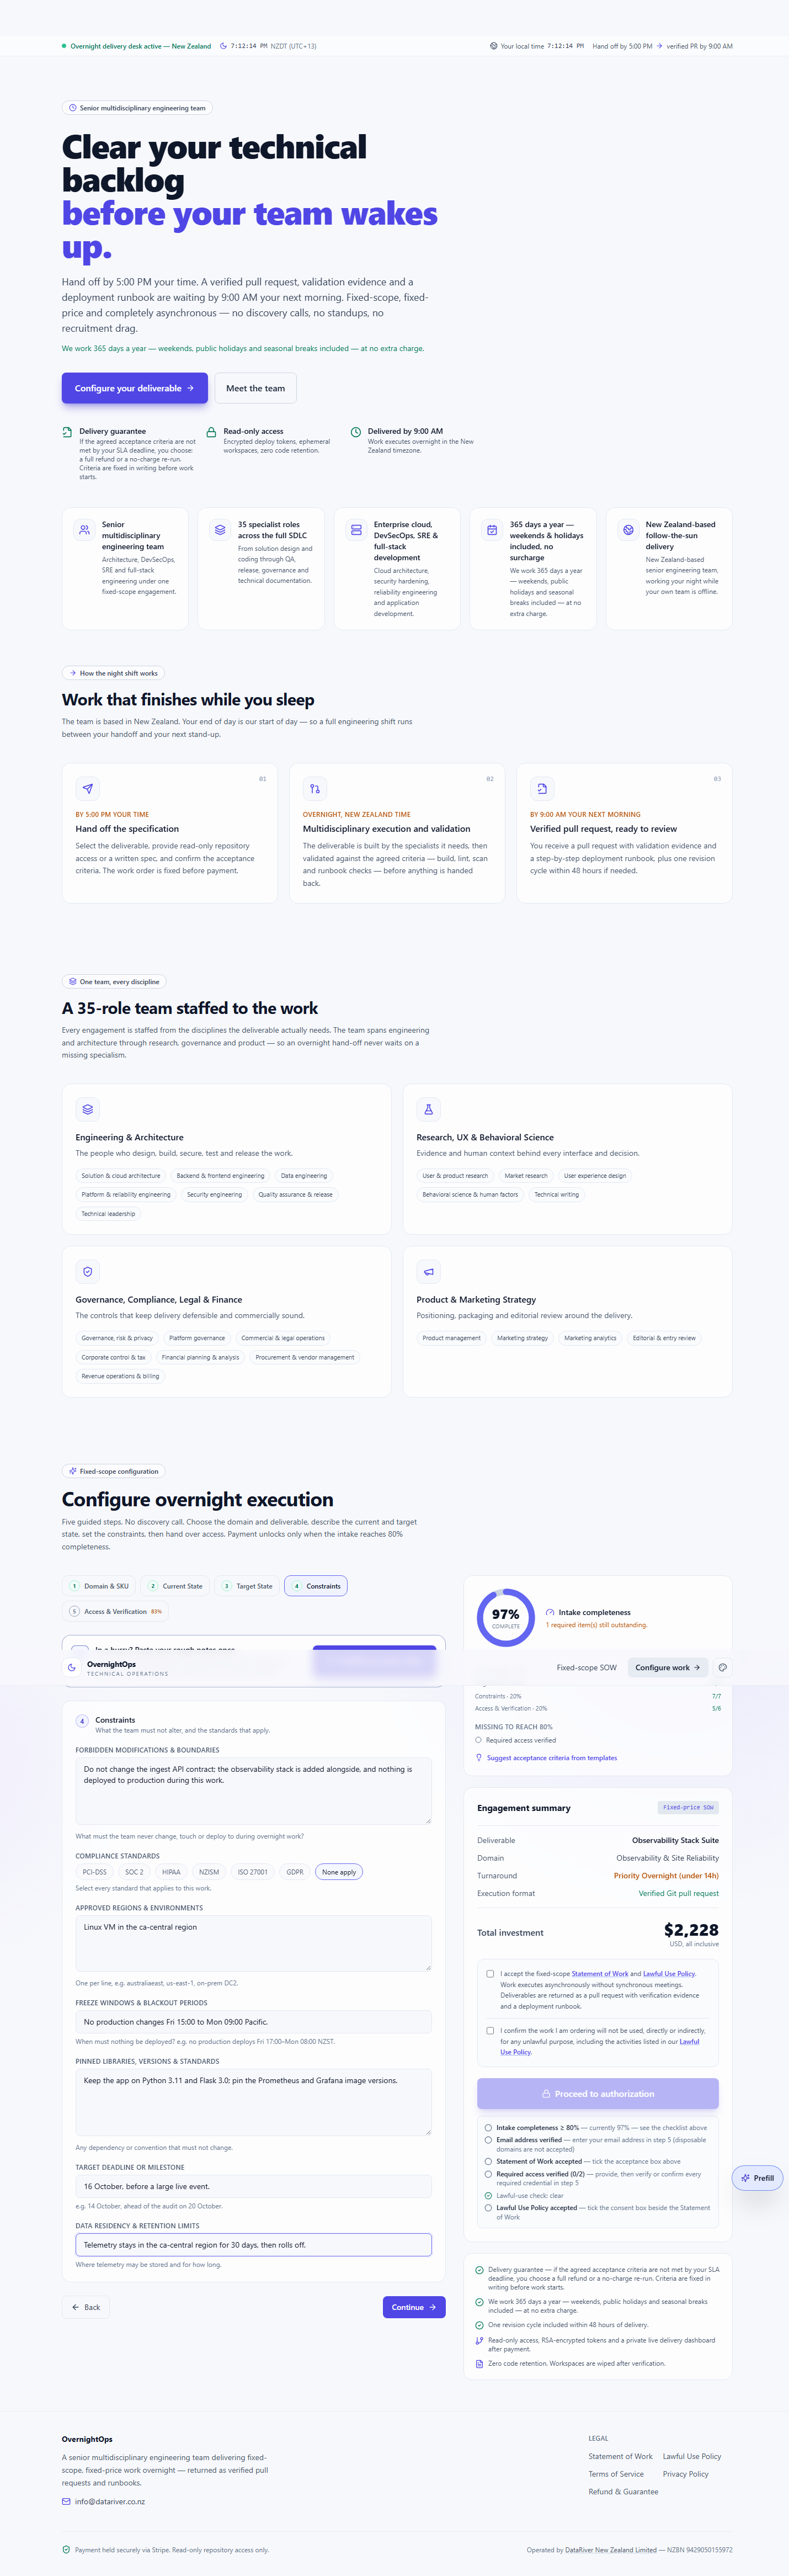
Do not change the ingest API contract; the observability stack is added alongside, and nothing is deployed to production during this work.
Compliance standards
- None apply
Approved regions & environments
- Linux VM in the ca-central region
Freeze windows & blackout periods
No production changes Fri 15:00 to Mon 09:00 Pacific.
Pinned libraries, versions & standards
Keep the app on Python 3.11 and Flask 3.0; pin the Prometheus and Grafana image versions.
Target deadline or milestone
16 October, before a large live event.
Data residency & retention limits
Telemetry stays in the ca-central region for 30 days, then rolls off.
05
Access & Verification
Repository access, read-only credentials, environments and verification.
Handover method
Repository access
Git repository URL
https://github.com/your-org/your-repoRead-only repository token
Encrypted in your browser before it leaves the device.
Environments in scope
- Linux VM
Metrics & log endpoints
App metrics endpoint will be exposed at /metrics on the VM; no external exporters.
Contact email
Acceptance criteria as captured
These are the testable statements fixed before payment. Delivery is checked against this list.
- The service exposes Prometheus metrics for request rate, error rate, latency and buffer depth.
- A committed `docker-compose.yml` runs the app with Prometheus and Grafana locally with the metric pull configuration wired.
- A committed Grafana dashboard JSON renders the RED metrics.
- Alert rules with thresholds plus a short `RUNBOOK.md` cover the two alert types.
From the live intake
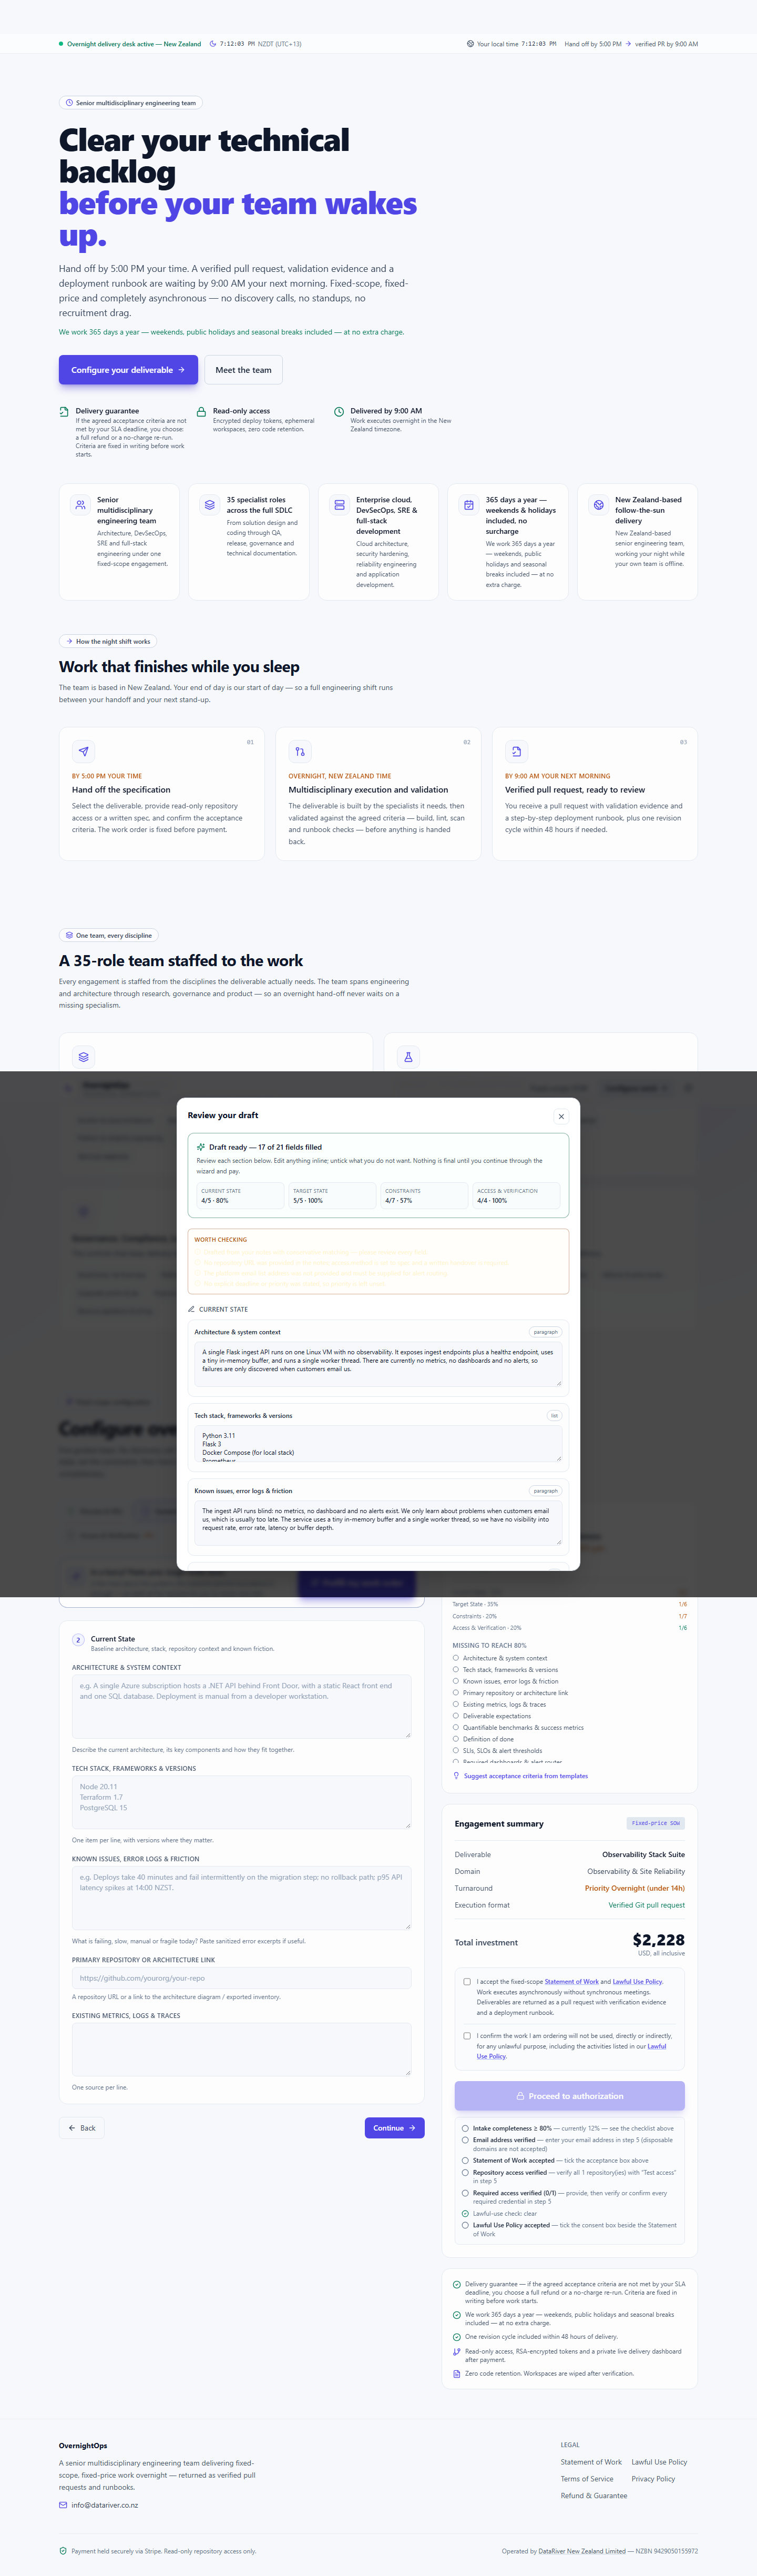
Captured screenshots of this work order being filled in. Each image is scrollable — scroll inside a frame to see the full page.
What happens after payment
Payment confirms the fixed scope. From there the work runs to the SLA you selected and every step is visible on your private dashboard.
The SLA clock starts
Your turnaround countdown begins the moment payment is confirmed — under 14 hours overnight, or 48 hours standard. Early delivery is always the goal.
A private dashboard
Your tracking link opens a private work-order dashboard showing the five delivery stages and every update as the work progresses.
Verified delivery
The deliverable is returned as a verified pull request or documented package, checked against the acceptance criteria you agreed before payment.
Your downloads
The final report, the acceptance-criteria results and every file in the delivery package are available on the dashboard until you close it.